DISCLAIMER: I do not condone monitoring network traffic with intent to spy or otherwise cause harm to people. My interest in the techniques described below is academic. I write in the hope that I can improve Internet security, or at least increase public awareness of vulnerabilities. If you are attempting to replicate my work, please be careful to do it in a controlled setting, such as your own home. Despite court rulings like this one, the legality of packet sniffing on public networks is very murky, and you may get in a lot of trouble.
I’ve spent a lot of time this year thinking about networking, the web, and security on the Internet. Since the Snowden leaks, revelations about the scale and sophistication of government cyberweapons have the public talking about the danger of metadatacollection. In response, I began to wonder how easy it would be for any would-be adversary to perform a practical collection attack on a standard WiFi network. In order to judge the difficulty for myself, I decided it was time to dabble in the Dark Arts.
Starting to Sniff
Enter Wireshark, a popular “packet sniffer”. Wireshark records, or “captures”, the various messages sent and received by your computer’s network card. If you’ve taken a class on computer networking, you’ve probably already downloaded the program; if not, you should get it now (for free) if you want to follow along.
Normally, Wireshark only captures the packets whose source or destination are your own computer. However, it can also be used to configure your network card to enter “promiscuous mode”, allowing you to capture all network traffic indiscriminately. The metaphorical equivalent is a mailbox that, instead of receiving letters addressed to a single house, receives a copy of every letter addressed to any house on the street. If you’re wondering why the network card has access to all messages on the network, consider that you need to see every message in order to determine which ones you are supposed to receive.
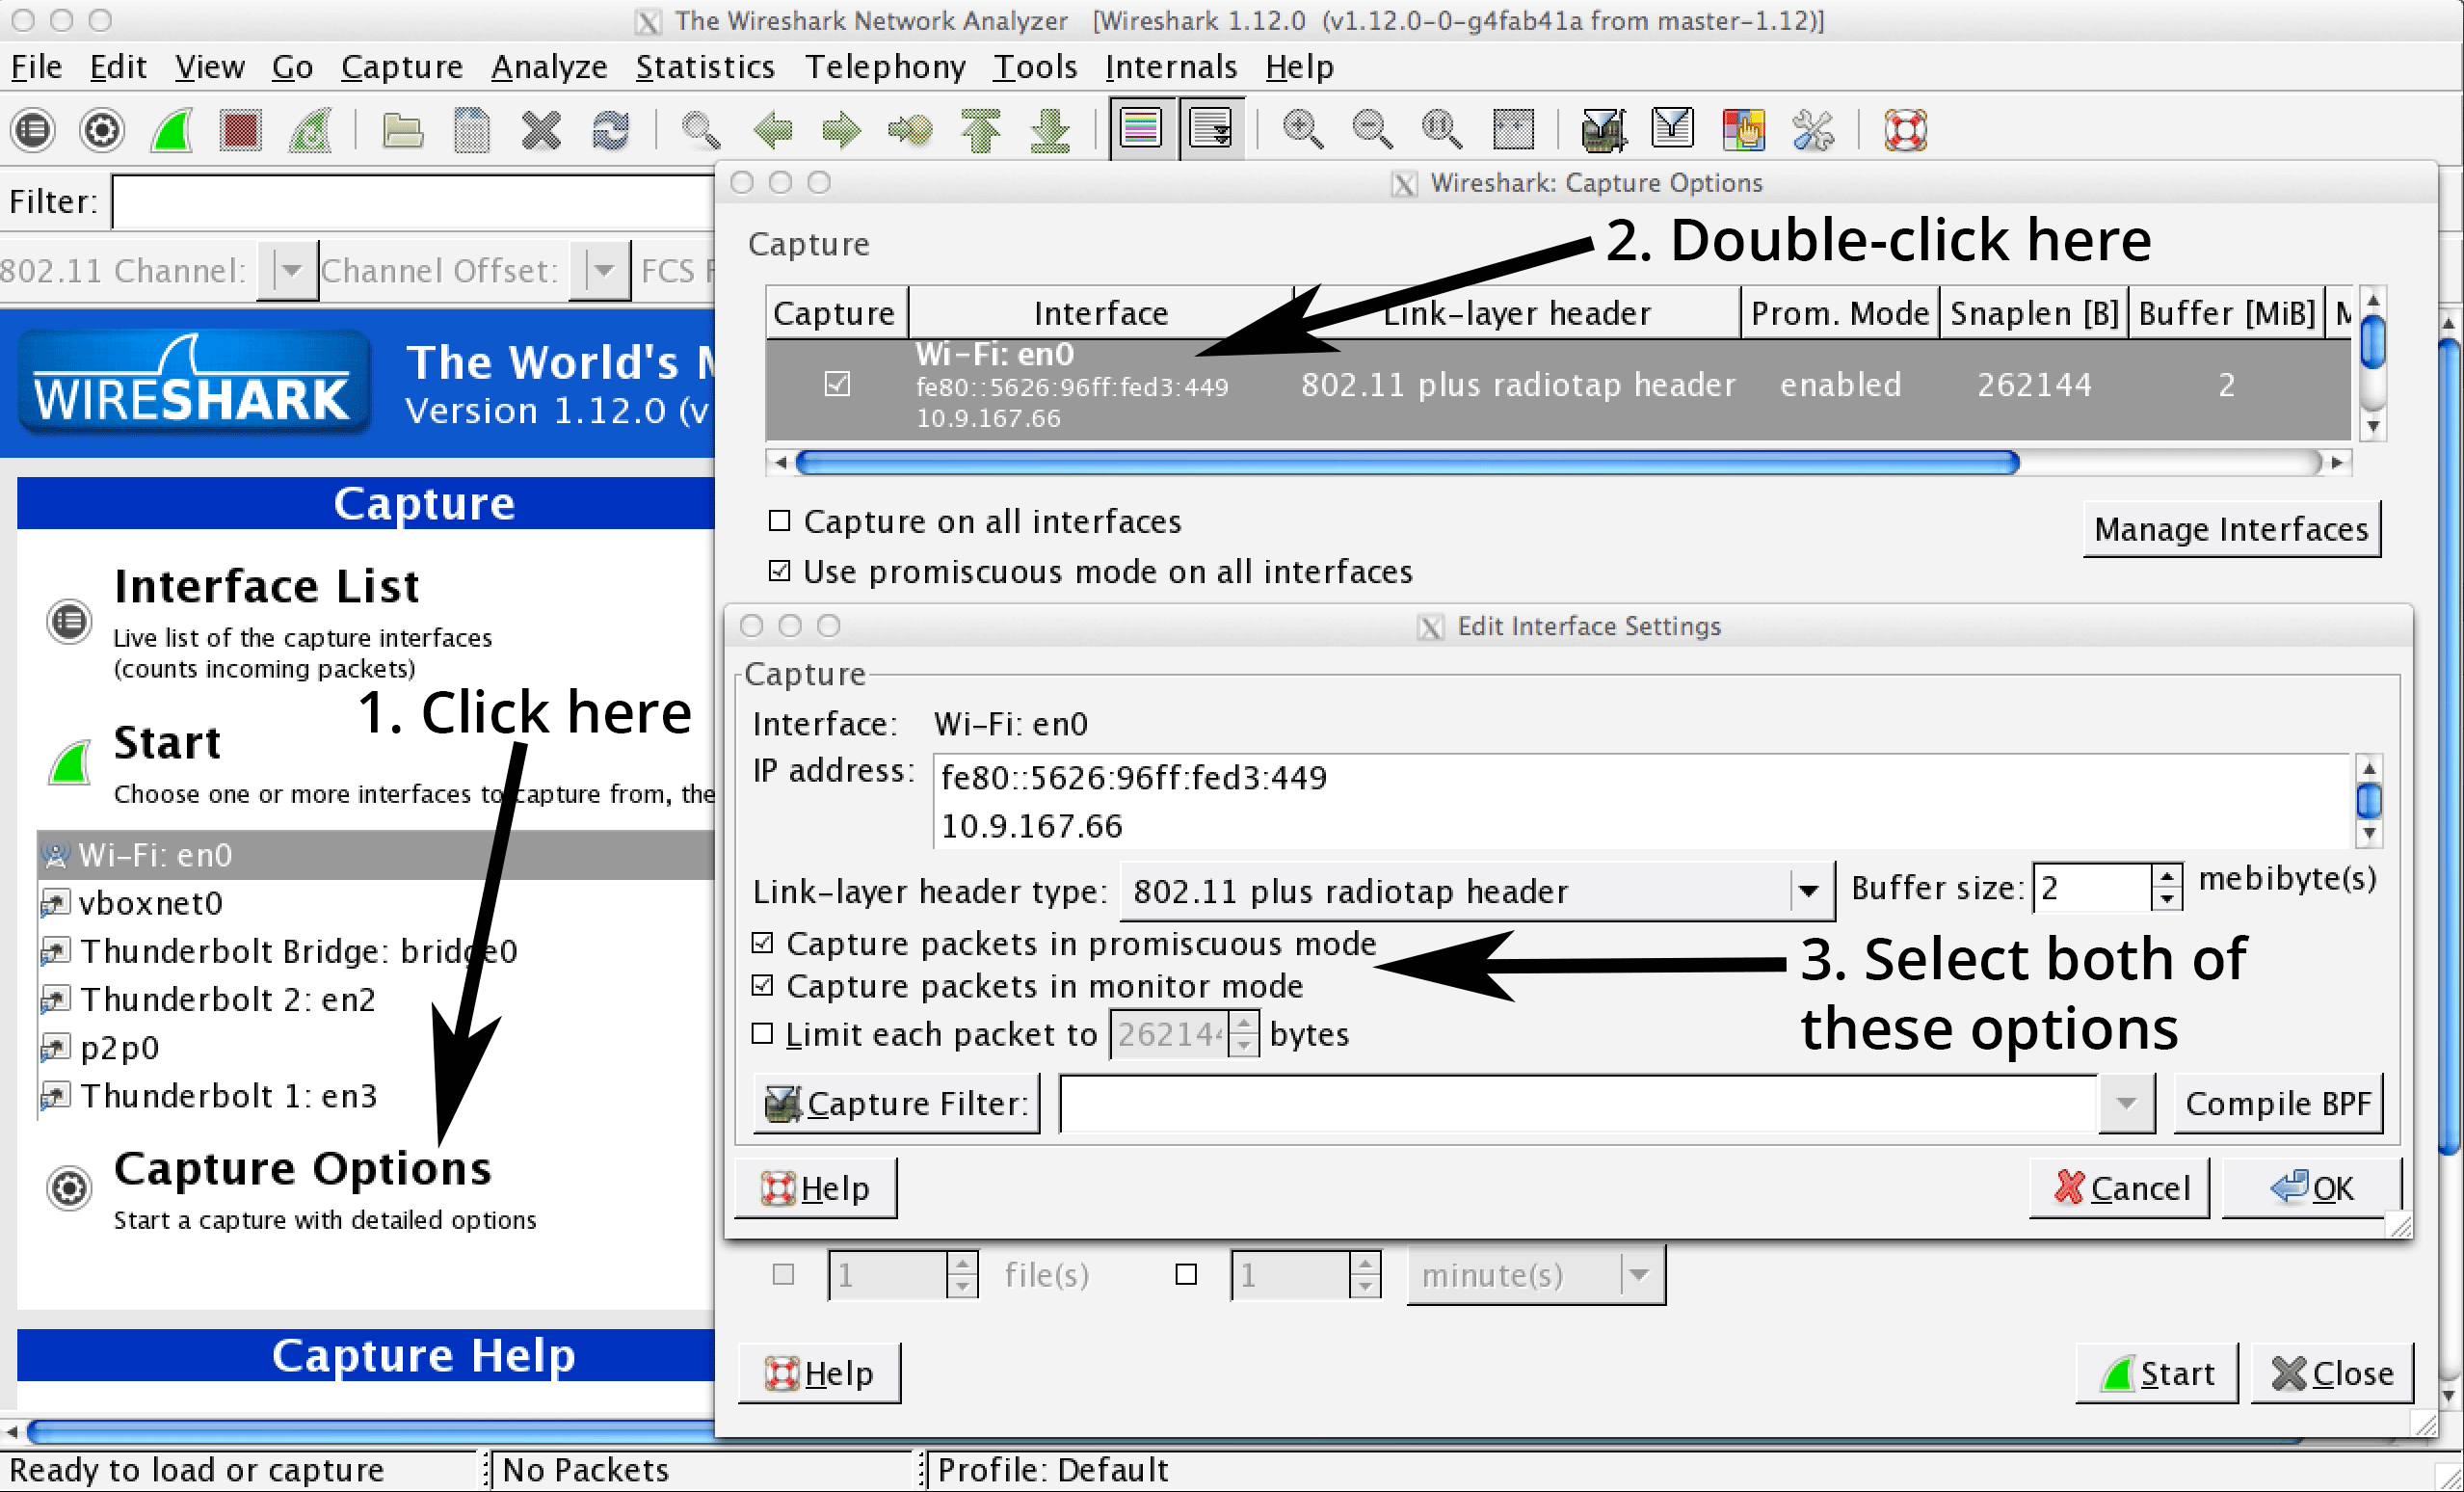
Entering promiscuous mode turns out to be remarkably easy; just go to ‘Capture Options’, double-click on the interface you want to capture on, and select the options to capture packets in promiscuous mode as well as monitor mode.1 I find it odd that entering promiscuous mode alone is not enough to perform the capture. Perhaps one of you can tell me why it works that way.2
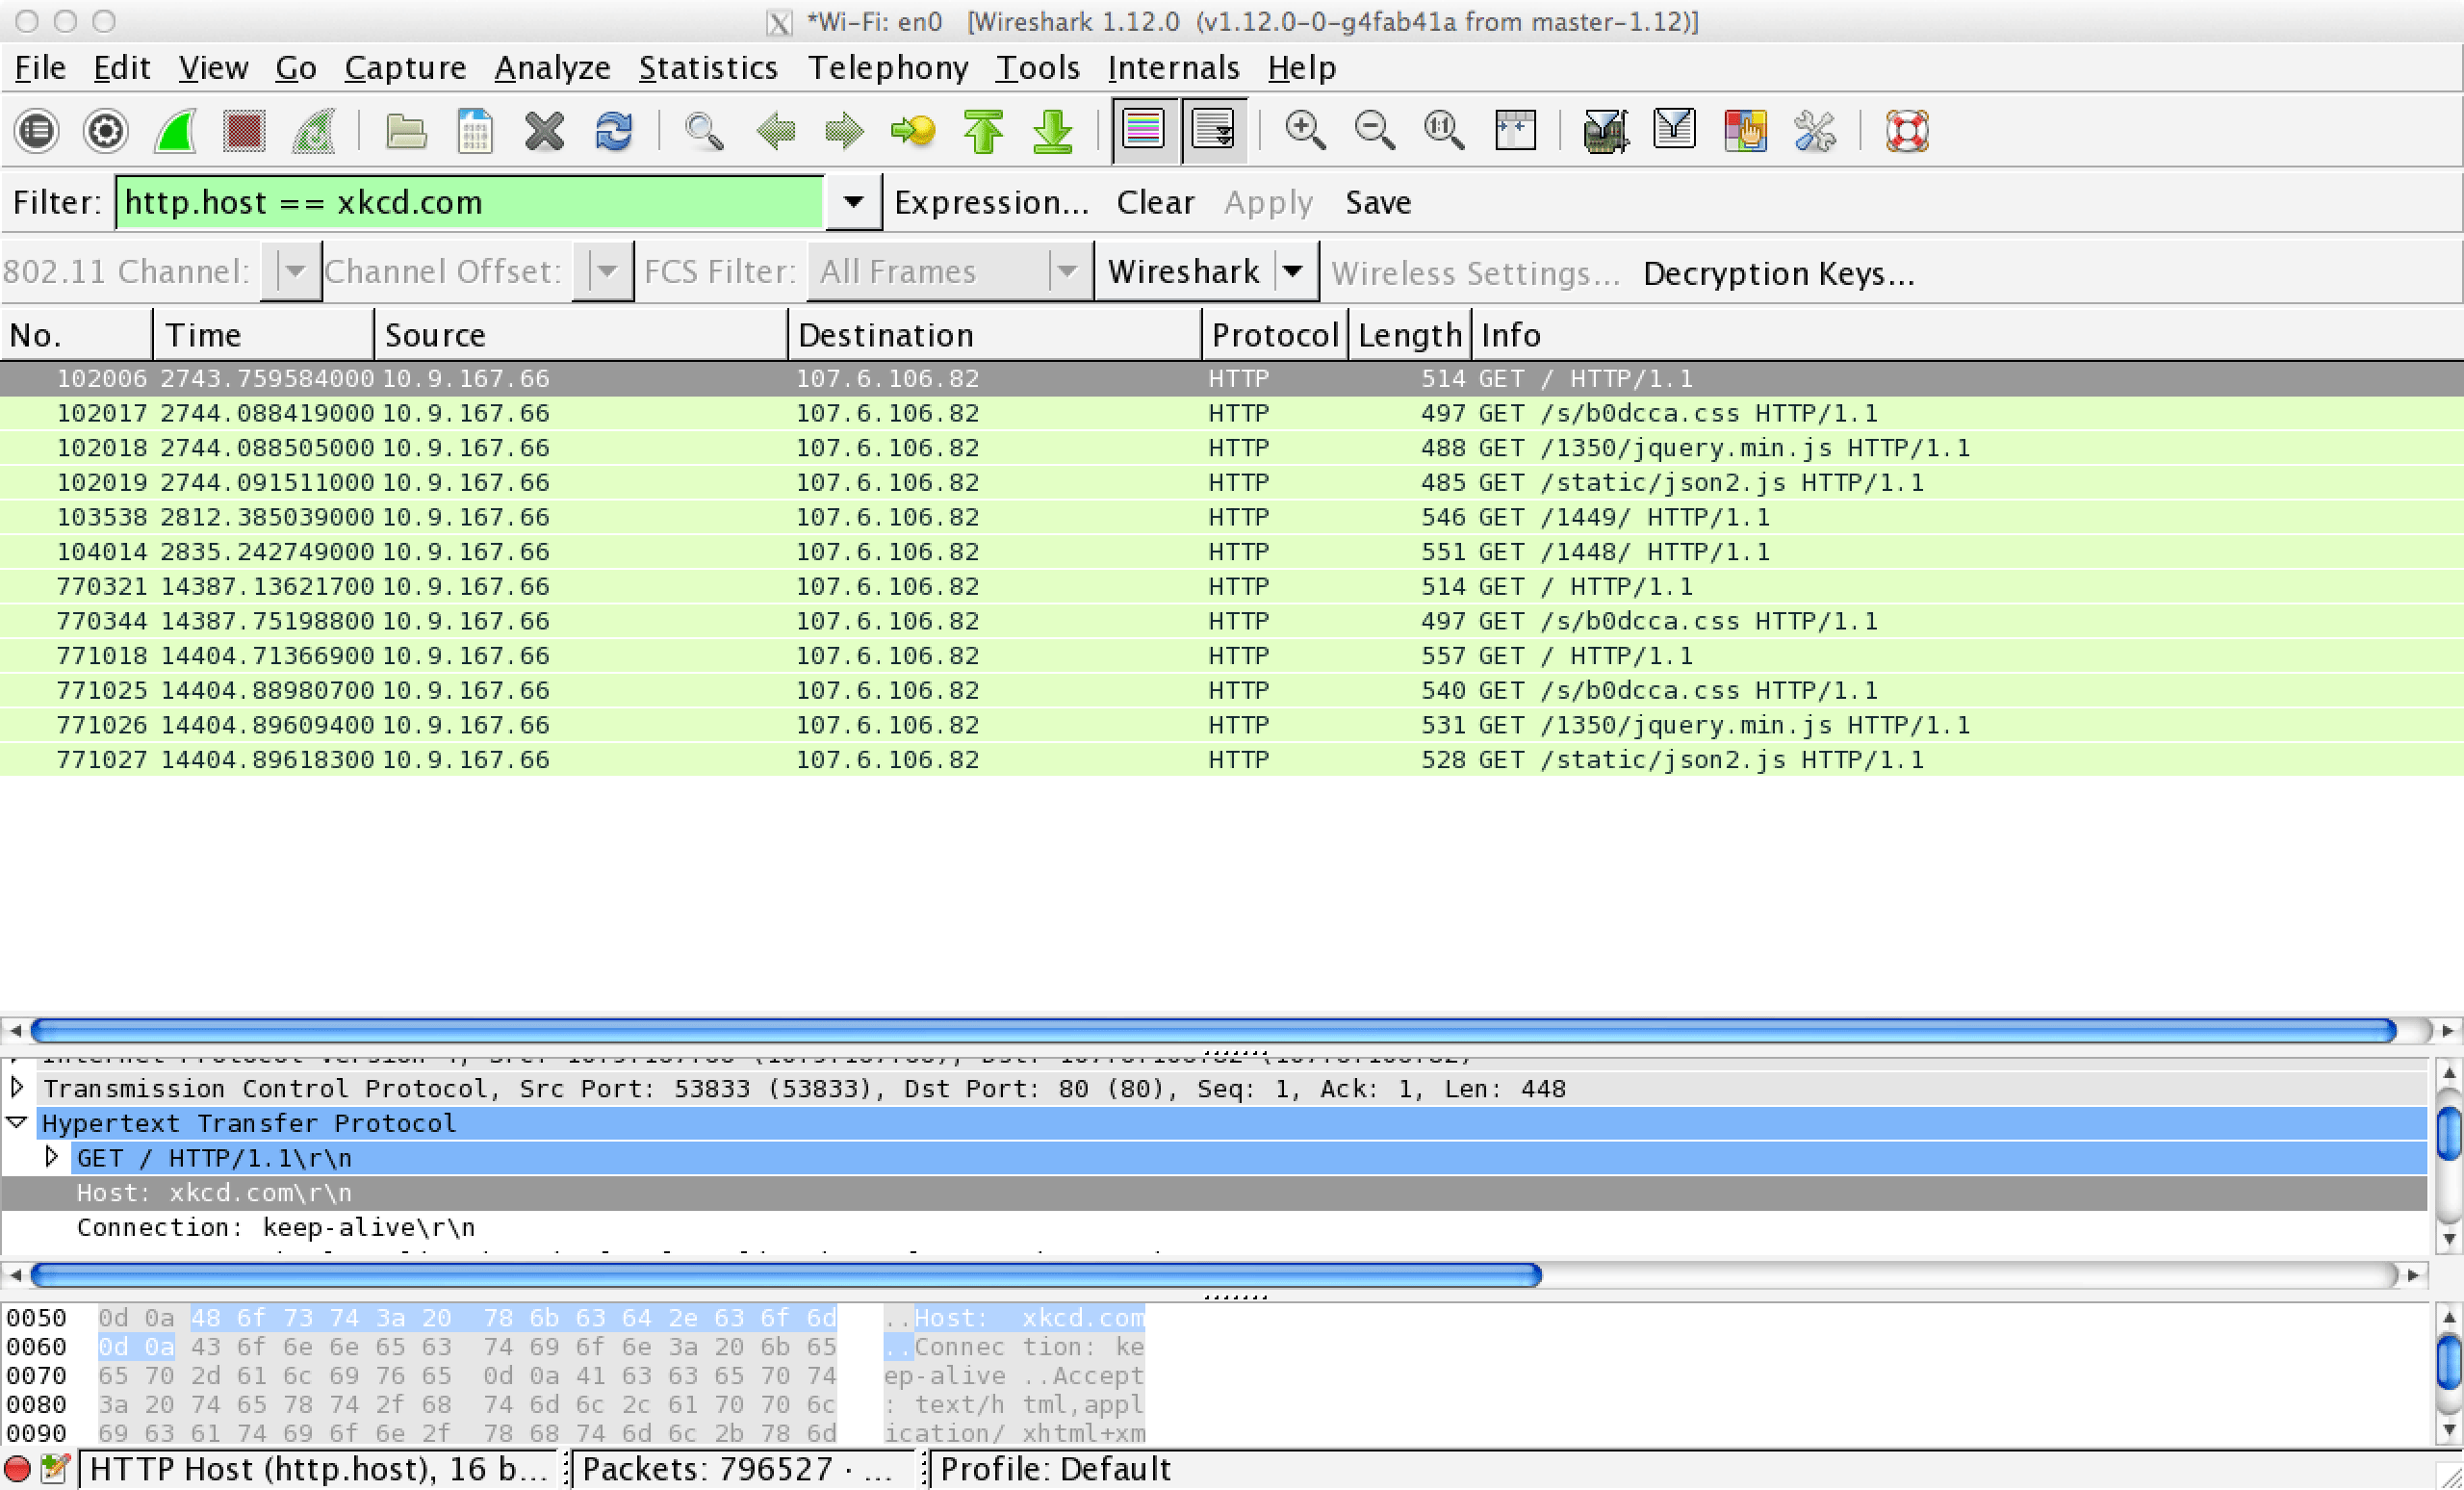
Your computer should now capture all packets observed at the interface, instead of only the packets going to or from your own machine. To confirm that you’re capturing all traffic on the network, type http.host == xkcd.com into Wireshark’s filter bar and go to xkcd.com from another device. If you capture the packets, you’re in business.
You should take some time to play around with Wireshark and understand exactly how much power you now have. Just by clicking two checkboxes, you can observe every message sent to and from your local router; you can collect the IP and MAC addresses of all nearby hosts; you can map every request for a web page back to its source, know what was requested, and read all unencrypted data. All you did to access this information was instruct your machine not to throw away messages destined for other clients. You didn’t have to tamper with network hardware or other machines, you didn’t hurt network performance, and nobody can detect what you’re doing.
The implications should concern you.
Look Ma, No GUI
Of course, Wireshark isn’t the easiest tool to use when it comes to actually analyzing the data you collect. You’ll still have to inspect packets manually in order to extract the information you’re looking for. What if you just want a list of all MAC address pairs which exchanged messages? Wouldn’t it be nice if you could programmatically collect, filter, and print only the packets or header fields you’re interested in?
Assuming you downloaded Wireshark, You already have just the tool for the job, called Tshark. Tshark provides CLI (command line interface) support for most of the actions you can do in Wireshark, making it possible to integrate network sniffing into your programs. The only catch is that, depending on how you installed Wireshark, You may have to find the Tshark binary and add its location to your PATH in order to use it.3
Let me demonstrate just how powerful Tshark can be. A few weeks ago at HackPrinceton, I presented a tool I called HostShark. HostShark sniffs the network for outgoing web traffic, both HTTP and HTTPS, and visualizes the hostnames of the traffic destinations using D3. I used Tshark to capture packets, extract the necessary header fields, and pipe the data to a Python program for further processing. Incredibly, that entire series of operations was performed in a single line of bash:
$ tshark -lIY "tcp.port==443 or http.request" -T fields -E separator="|" -e ip.dst -e http.host 2> /dev/null | python process.pyI won’t explain what each of these command line options is for (tshark help is your friend), but I’ll give you the gist. This command promiscuously captures outgoing HTTP and HTTPS packets. HTTP traffic may be filtered directly via http.request, but HTTPS traffic is a little bit more complicated because Tshark and Wireshark don’t provide a built-in filter. However, we can create a de facto filter with tcp.port==443, taking advantage of the convention for HTTPS traffic to use port 443. We now extract the destination IP and HTTP hostname from the packet, separating the values with a vertical line (‘|’). For example, a request to xkcd.com might result in the output “107.6.106.82|xkcd.com”. Note that HTTPS traffic will not have an HTTP hostname header, so the returned value will be the empty string. The extracted data is finally piped to the Python program below:
1
2
3
4
5
6
7
8
9
10
11
12
13
14
15
16
17
18
19
20
21
22
23
24
25
26
27
28
29
30
31
32
33
34
35
import json
from socketIO_client import SocketIO
import sys
import time
import urllib2
ips = {}
with SocketIO('localhost', 7717) as socketIO:
try:
buff = ''
while True:
buff += sys.stdin.read(1)
if buff.endswith('\n'):
parts = buff[:-1].split('|')
if (parts[1] is ''):
if parts[0] not in ips:
# make the API call here
data = json.load(urllib2.urlopen('http://stat.ripe.net/data/reverse-dns-ip/data.json?resource=' + parts[0]))
if data['data']['result'] is not None:
ips[parts[0]] = data['data']['result'][0]
socketIO.emit('host', { 'host': data['data']['result'][0] });
else:
ips[parts[0]] = None
else:
lookup = ips[parts[0]]
if lookup is not None:
socketIO.emit('host', { 'host': lookup });
else:
if parts[1] != "stat.ripe.net":
socketIO.emit('host', { 'host': parts[1] });
buff = ''
except KeyboardInterrupt:
sys.stdout.flush()
pass
Again, I won’t go into detail about how this program works (partly because it doesn’t matter, and partly because I’m not a Pythonista and don’t want to teach bad practices). It takes each incoming line, splits it at the ‘|’ and checks if the hostname is non-empty. If so, the hostname is forwarded to a server via Socket.io. Otherwise, the hostname must first be determined through a reverse DNS lookup on the IP address. The ips dictionary stores the results of the lookups to prevent duplicate requests to the lookup API.
Hostbusters
Now that I’ve revealed the gooey center of HostShark, let’s see it in action. I’m not going to bother with explaining the frontend or backend code here, since that isn’t the point of this blog post. You are, of course, encouraged to check out the rest of the code on my GitHub, and pull requests are welcome.
A few notes on how HostShark works. The visualizer refreshes every fifteen seconds and shows the hostnames of all requests made in the past minute. The hostnames are displayed heirarchically as a series of concentric arcs. The innermost arcs represent top-level domains (TLDs). Every subsequent arc is a subdomain of the one within.
Here’s a screencast of HostShark in action:
You’re Gonna Need a Bigger Boat
When you eavesdrop on connections without interfering with them, you are performing what is known as a “passive” attack. HostShark is just one example of a passive attack. Other possible passive attacks include mapping all communicating pairs of hosts or simply analyzing the contents of HTTP packets.
Passive attacks take advantage of three fundamental limitations of modern networking:
- Network protocols leak metadata. HTTPS and SSL encryption may protect your data from prying eyes, but the encrypted payload must still be wrapped in TCP, IP, and ethernet headers in order to be transported to its destination. Those headers expose IP addresses, MAC addresses, and other transport details. The headers themselves cannot be encrypted because routers and switches must be able to read them in order to forward the traffic; this is an inherent limitation of the design of the Internet.
- The destination of your traffic may reveal your intent. This is really a corollary to #1. Given that the source and destination of a message is public knowledge, the corresponding payload is only truly private if a third party cannot guess the contents with greater than negligable probabilty. In the case of requests made to well-known services on the Internet, it might be possible to make quite educated guesses about what is being exchanged. For example, if I know you’re sending messages to united.com, I can probably guess that you’re booking a trip. If you’re visiting WikiLeaks or freedom.press, I know you’re interested in political activism. The danger increases as websites use subdomains to divide services. If you watch the screencast above, you will see that Facebook uses different subdomains for their various frontend proxies. By analyzing the traffic, I might be able to determine that edge-star-shv-04-atl1.facebook.com is used to serve requests for images, while channel-proxy-shv-04-frc3.facebook.com handles comments or chat. Even if I can’t read the traffic, I have fine-grained knowledge of what you are doing.
- Passive attacks are undetectable. As I said before, there is no change to any machine except your own, and nobody else’s network service is negatively impacted by your actions. As long as nobody is looking over your shoulder, you are completely invisible.
Unfortunately, until a solution to these limitations is devised (and widely deployed!), there is no way to prevent passive attacks from occurring. You can only hope to mitigate the damage by exercising discretion on public Internet. For now, the sharks roam free.
Next Steps
In this post, I describe a family of attacks based on passive observation of the traffic on the network. Passive attacks are not the end of the story, however. If an attacker is able to insert herself along the “path” between two hosts, becoming one of the computers to receive and forward the packets, she can perform an “active” attack by modifying packets mid-transit. Such an attacker is known as a man-in-the-middle (MitM). MitM are extremely dangerous because they may cause an end host to reveal information which would have otherwise remained secret. For instance, a MitM could change a webpage to transmit login credentials insecurely. The only disadvantage of an active attack over a passive attack is the possibility of being detected. Fortunately, Princeton detects (some) active attacks.
I don’t have any plans to write about active attacks right now. I’m reluctant to teach such a powerful and harmful technique. That being said, the knowledge is out there for those who are willing to do a little digging.
-
Note that your computer may not come with a network card capable of promiscuous network monitoring. I have no problems on a 2013 Macbook, and I’d expect even older Macs to work as well. With PCs, it depends on the hardware vendor. ↩
-
Since It is possible that the behavior is dependent on the hardware or operating system. ↩
-
On Mac, I found the Tshark binary at
/Applications/Wireshark.app/Contents/Resources/bin/tshark. I added it to my PATH by making a softlink from my/usr/local/bindirectory to the location of the binary. ↩
